21 Sep 23
Securing content through the use of tokens
In this post we discuss how to secure the delivery of video content with tokens and what strategy we use in our CDN.

Alberto Suarez
29 Jul 25

At Transparent Edge, we’re constantly improving our dashboard to ensure our clients have maximum visibility and control over what’s happening on their websites and web applications. In this post, we’re introducing one of the latest updates: a new tab dedicated exclusively to Denial-of-Service (DDoS) attacks, now available to all Perimetrical users.
This new feature joins the already available sections related to delivery, WAF, and Bot Mitigation services, among others.
The new panel provides specific, filtered data on requests identified as DDoS attacks—one of the most common threats to the web vector across all industries.
The dashboard displays visual insights on IP addresses, cookies, user agents, headers, languages, countries of origin, and more. These metrics are valuable forensic tools to help clients understand what has happened—particularly at the application layer—after an attack.
While the default view comes preconfigured, each user can customize their own widgets to focus on the data most relevant to tracking events on their websites and apps.
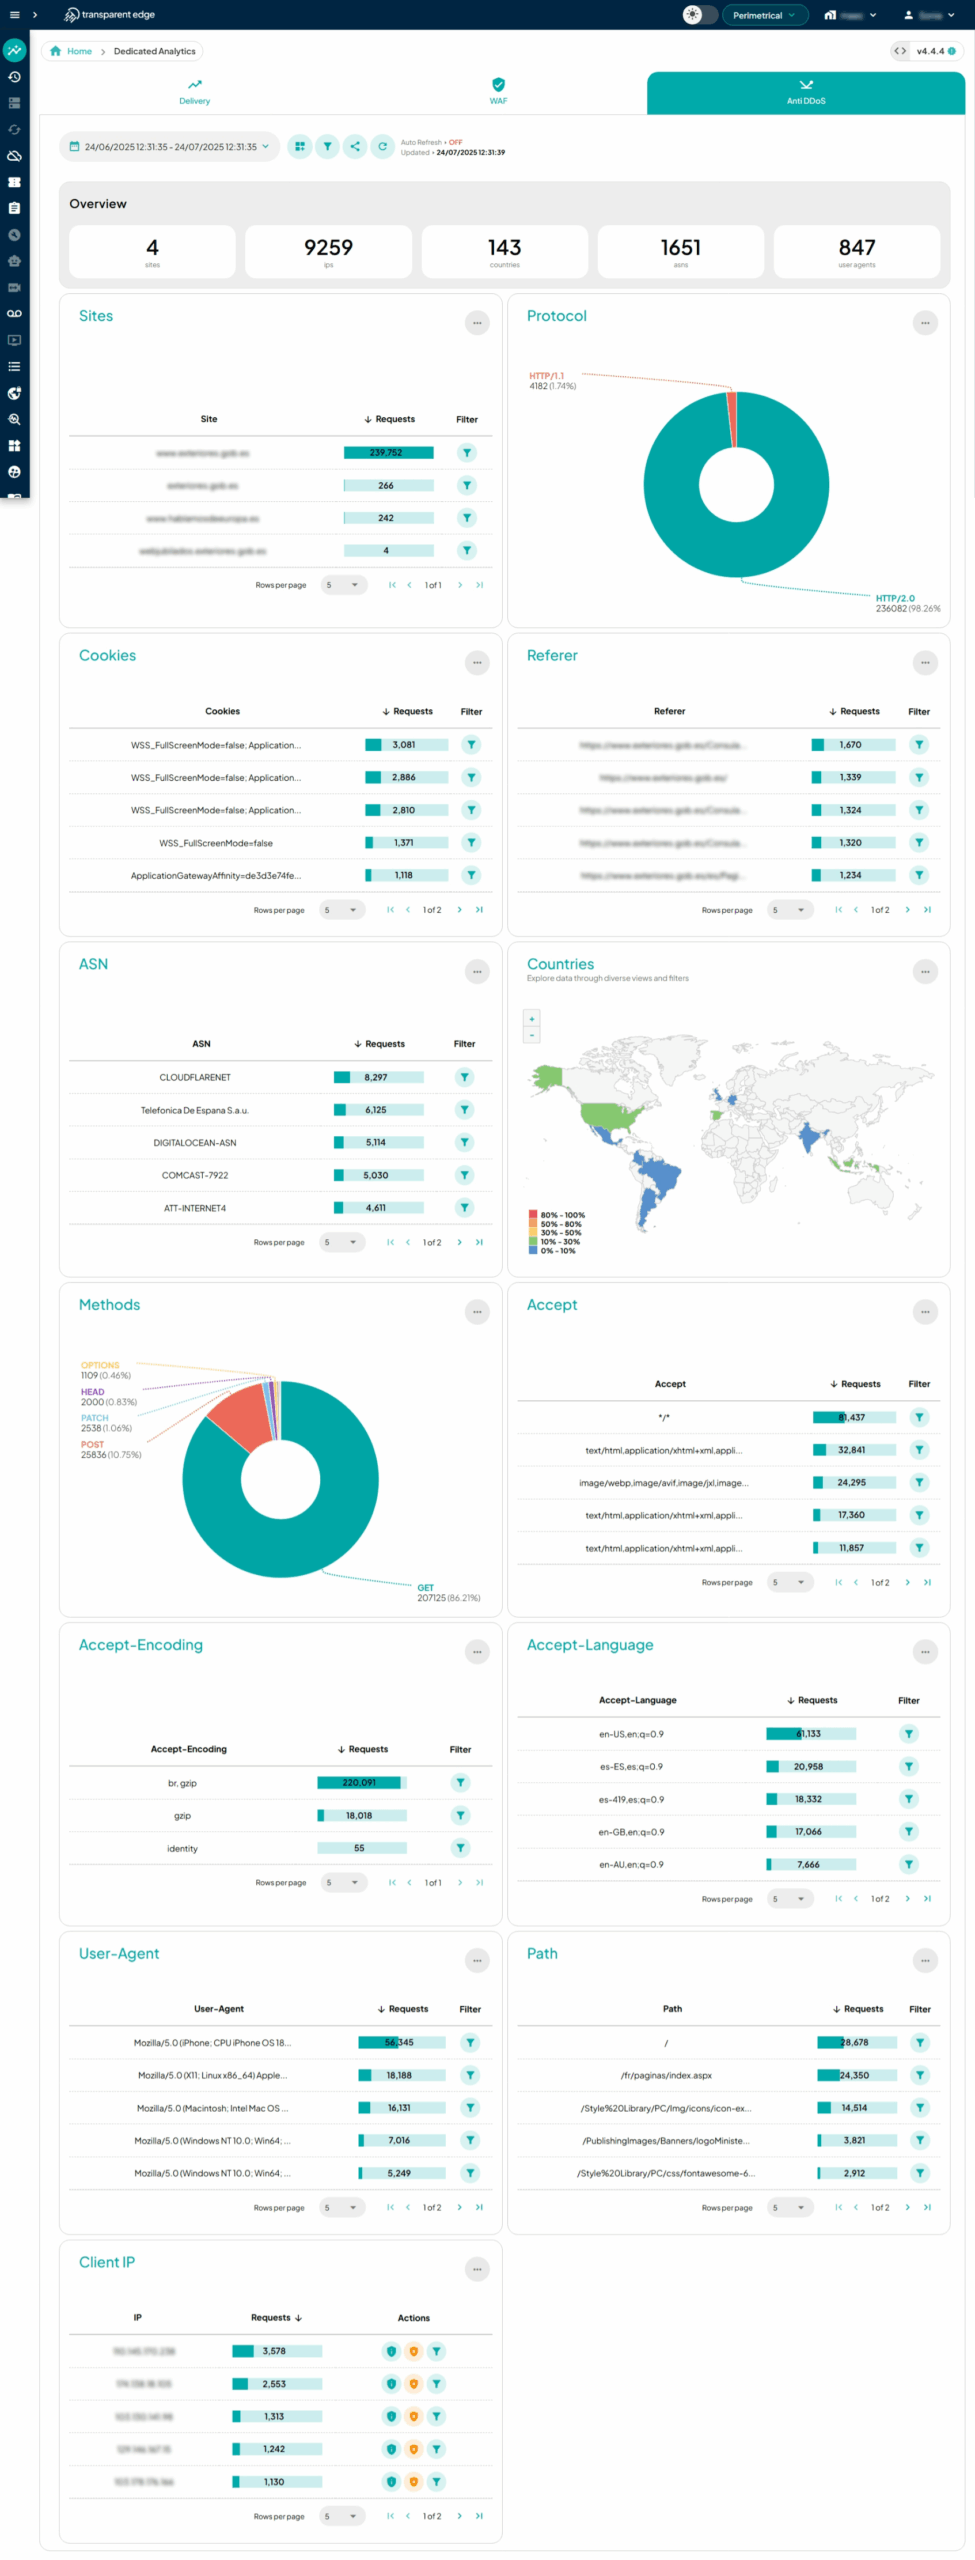
Bringing all DDoS-related information into one visual and centralized tab allows us to enhance the user experience. The new Anti-DDoS section:
The new tab is already available for all Perimetrical users. If you’re one of them, just log in to your control panel, go to the analytics section, and open the “Anti DDoS” tab. If you need help interpreting the data or setting up custom alerts, our team is here to support you.
We’re committed to making it easier every day to protect your business.
Compartir: